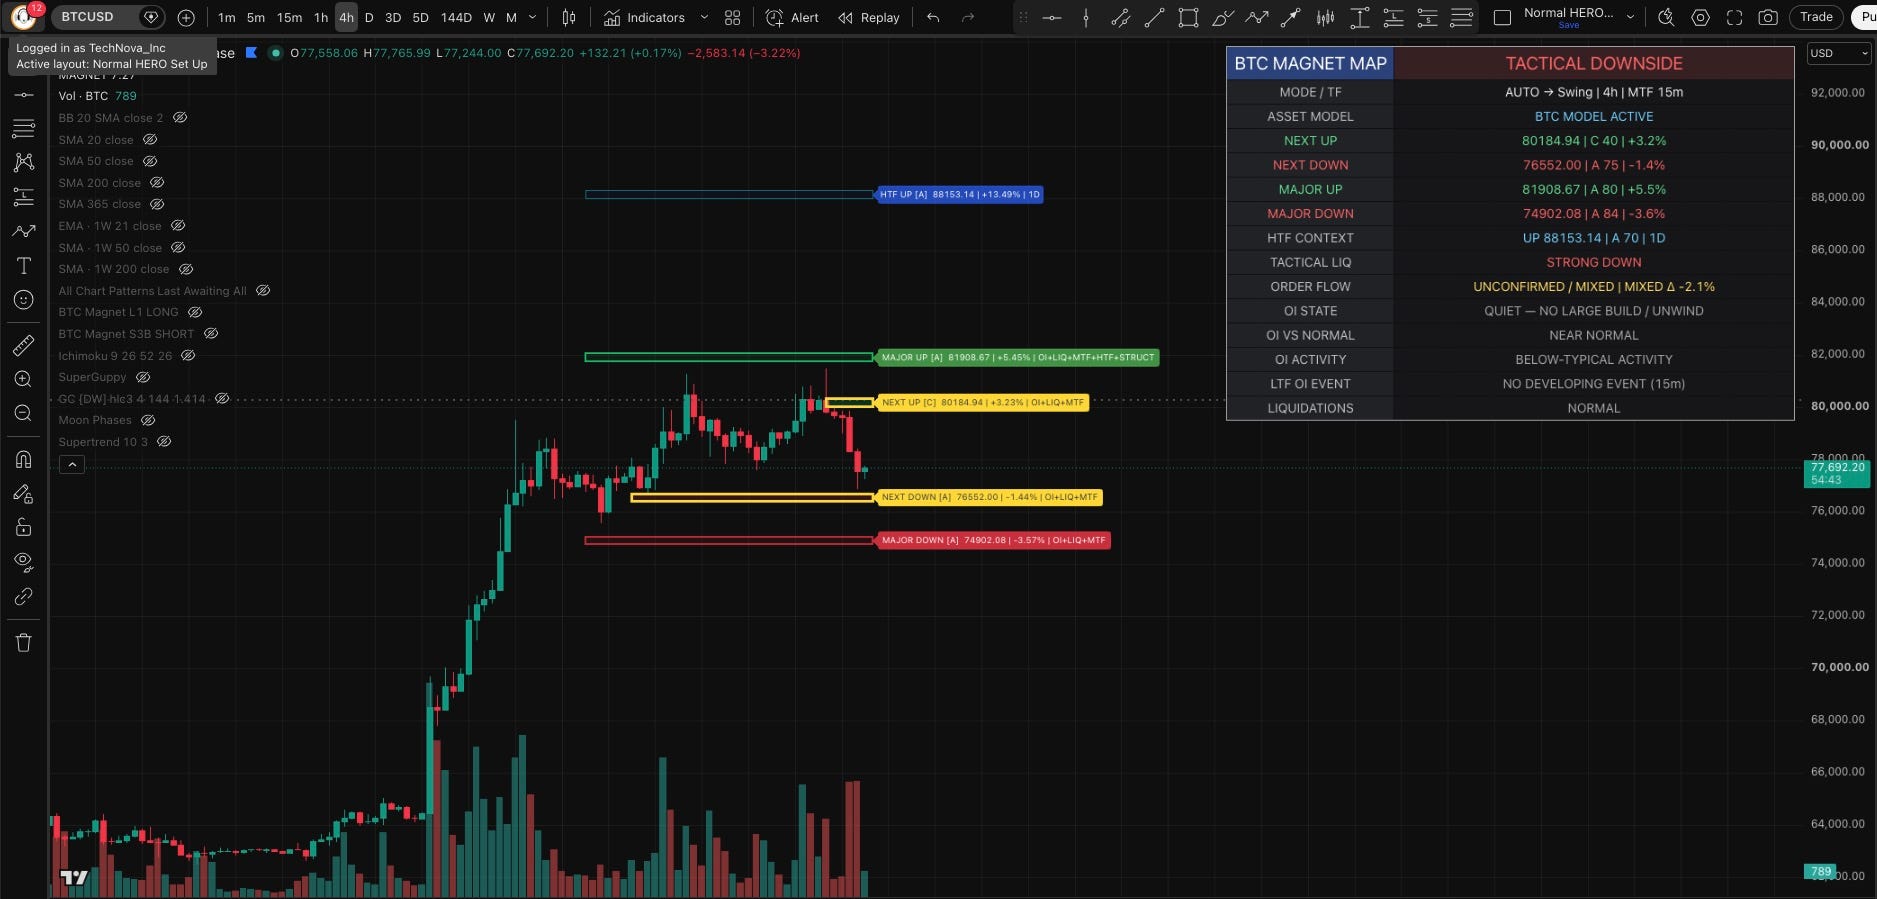
The Crypto Liquidity Magnet Map

Crypto Liquidity Magnet Map is a multi-factor market-mapping indicator for BTC, ETH and SOL.

It estimates where meaningful liquidity and leveraged positioning may exist above and below current price, then ranks those areas using Open Interest behavior, native footprint order flow, liquidation activity, structural liquidity, persistence and multi-timeframe context. Rather than issuing simplistic BUY or SELL signals, the tool is intended to answer a different question:

Where is price most likely to encounter meaningful liquidity next, and what does the surrounding derivatives/order-flow environment look like?

The dashboard displays NEXT and MAJOR liquidity magnets, higher-timeframe context, tactical liquidity balance, order flow, Open Interest state, lower-timeframe OI events and liquidation conditions. The indicator automatically supports BTC, ETH and SOL, and when used on those assets it automatically routes derivatives context from Binance, Bybit and OKX to the matching asset. This is a decision-support and trade-context tool, not a guaranteed liquidation map or a complete trading system.


A Video Explanation of this tool can be found by using this link:

Crypto Liquidity Magnet Map Video


Disclaimer

This indicator is provided for informational, educational and research purposes only.

Liquidity zones, inferred OI-at-price pools, liquidation areas and other projections are model-derived estimates and may not correspond to actual resting orders or individual market participants’ positions.

Past statistical behavior does not guarantee future results.

This indicator is not financial advice and should not be used as the sole basis for a trading or investment decision.